
What ODP’s FY 2023–24 Data Tells Us
Pennsylvania’s Office of Developmental Programs has released its FY 2023–24 Annual Data Report, providing an updated look at the number of people receiving developmental disability and autism services, the programs supporting them, and how Pennsylvania is using and spending its state and federal resources.
Compared with FY 2022–23, and years prior, the latest data tells an interesting story.
The overall ODP system continues to grow, but that growth is not happening evenly across programs. Enrollment in the Community Living Waiver increased substantially, while enrollment in several other programs declined. At the same time, Pennsylvania’s spending on ID/A waiver services surpassed $4.5 billion, and the demographic makeup of the population receiving services continued to change.
Here are some of the most significant developments in the 2023–24 Annual Data Report.
Nearly 60,000 Pennsylvanian Residents Received ODP Services
The broadest measure of the system shows continued growth, which was expected year over year.
According to the chart on page 4 of the FY23–24 report (shown in the image below), 59,853 people were enrolled in an ODP program at some point during FY23–24, compared with 58,472 in FY22–23. That’s an increase of 1,381 people, or about 2.4% in one year.
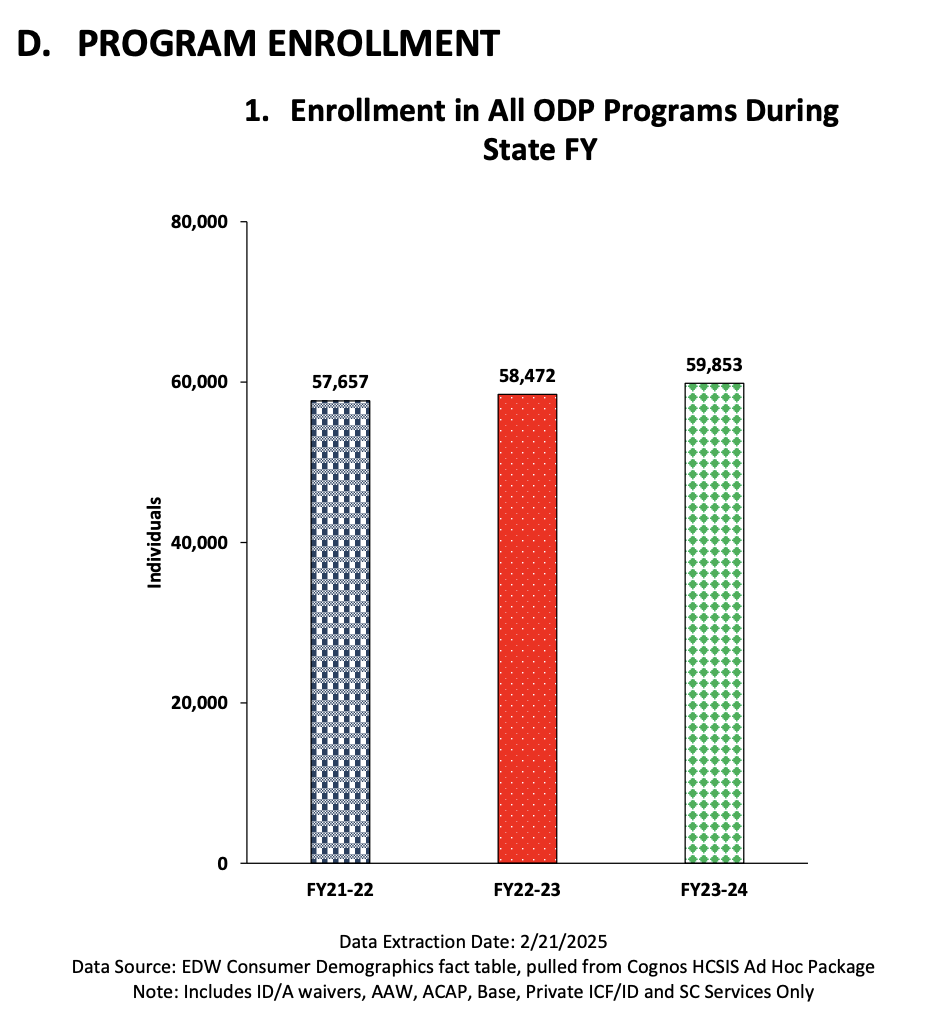
The longer trend is also noteworthy:
| Fiscal Year | Individuals Served |
|---|---|
| FY21–22 (view report) | 57,657 |
| FY22–23 (view report) | 58,472 |
| FY23–24 (view report) | 59,853 |
ODP‘s system therefore served about 2,200 more people than it did just two years earlier.
But the overall number hides much larger changes occurring within individual programs, so let’s dig into these larger changes that could affect Pennsylvanians statewide.
The Community Living Waiver Saw Another Major Increase
Perhaps the most striking enrollment change in the new report involves the Community Living Waiver (CLW).
During FY22–23, 5,644 individuals were enrolled in CLW. In FY23–24, that jumped to 7,336 people—an increase of 1,692 participants, or roughly 30% in a single year. This may be great news for any individuals who were previously awaiting services.
Looking further back to FY 2020-2021 makes the trend even clearer:
| Fiscal Year | CLW Enrollment During FY |
|---|---|
| FY20–21 (view report) | 3,959 |
| FY21–22 (view report) | 4,682 |
| FY22–23 (view report) | 5,644 |
| FY23–24 (view report) | 7,336 |
Based on these numbers, and the assumption that they are accurate, that means CLW enrollment increased 85% between FY20–21 and FY23–24.
The last-day-of-fiscal-year numbers tell essentially the same story: CLW enrollment rose from 5,455 at the end of FY22–23 to 7,174 at the end of FY23–24.
This is one of the clearest changes in the entire report and reflects a substantial shift in where people are enrolled within Pennsylvania’s waiver system.
P/FDS Enrollment Moved Sharply in the Opposite Direction
While Community Living Waiver enrollment grew, the Person/Family Directed Support (P/FDS) Waiver moved in the opposite direction.
Enrollment during the fiscal year fell from:
13,251 in FY22–23 → 11,371 in FY23–24
That’s a decrease of 1,880 people, or approximately 14.2%.
The end-of-year population also dropped from 11,720 to 10,557.
This isn’t simply a one-year phenomenon. P/FDS enrollment during the year has declined from 14,625 in FY19–20 to 11,371 in FY23–24, while CLW enrollment increased from 3,772 to 7,336 over that same period.
That divergence is arguably more important than the modest growth in ODP‘s total enrollment. The composition of Pennsylvania’s waiver population is changing considerably even when the total number of people served changes relatively slowly.
Is the decrease inP/FDS a good or bad thing?
The P/FDS waiver offers a limited budget of around $47,000 per fiscal year, with an additional allowance of $15,000 reserved for certain employment-related services only. In comparison the CLW waiver offers a higher limited budget of around $97,000 per fiscal year (around a $50,000 increase in budget), and excludes supports coordination services from the budget cap to allow the funds to be used for the services most needed.
NOTE: Often, a P/FDS waiver is a great option for low-intensity needs with individuals who live at home with their families. The P/FDS waiver may not be the best option for significant behavioral issues or for individuals who need residential services.
Consolidated Waiver Enrollment Remained Relatively Stable
The Consolidated Waiver remains ODP‘s largest ID/A waiver program.
Unlike the substantial changes seen in the CLW and P/FDS waivers, Consolidated Waiver enrollment changed relatively little during FY23–24. The number of people enrolled at some point during the fiscal year increased from 18,949 in FY22–23 to 19,019 in FY23–24, an increase of just 70 people, or 0.4%.
Looking at enrollment on the final day of each fiscal year, however, the increase was somewhat larger. Year-end enrollment rose from 18,364 to 18,811, an increase of 447 people, or approximately 2.4%.
The broader trend is one of relative stability: while Community Living Waiver enrollment expanded substantially and P/FDS enrollment declined, Consolidated Waiver enrollment remained around 19,000 participants.
So unlike the major movements in CLW and P/FDS, Consolidated Waiver enrollment remains comparatively stable.
While it is encouraging to see a high level of individuals receiving the services they need, one important thing to note is that the Consolidated Waiver is the most expensive waiver for IDD support in the state of Pennsylvania. This could be a long term sustainability issue for Pennsylvania.
Base-Only, ICF/ID and State Center Populations Continued to Decline
Several other parts of the system contracted.
During FY23–24:
- Base Only: 5,472 → 4,761, down about 13%
- Private ICF/ID: 1,552 → 1,408, down about 9%
- State Center: 573 → 474, down about 17%
- SC Services Only: 16,486 → 15,054, down about 9%
Taken alongside the rapid increase in CLW enrollment, these figures show that ODP‘s overall growth doesn’t mean every component of the system is expanding.
The Age Distribution Changed Significantly
One of the more interesting—and easy to overlook—updates appears on page 8.
Enrollment among people under age 21 increased considerably from 9,467 → 10,957. That’s an increase of 1,490 people, or nearly 16%.
Enrollment among people ages 21–45 also increased from 28,805 → 29,803. Meanwhile, the 46–64 group declined from 11,088 → 9,680. Lastly, enrollment among adults 65+ increased slightly from 4,293 → 4,410.
That means the system isn’t simply growing—it is seeing a meaningful change in the age distribution of the people represented in these ID/A programs.
For providers and policymakers, the increase among younger participants is especially worth watching because those individuals will eventually transition into adult service systems, potentially creating different long-term service, staffing and technology needs.
Autism Program Enrollment Remained Remarkably Stable
In contrast to the changes elsewhere, Pennsylvania’s two adult autism programs remained relatively stable.
For the Adult Autism Waiver (AAW), enrollment during the fiscal year moved from 714 in FY22–23 to 713 in FY23–24.
For the Adult Community Autism Program (ACAP), enrollment changed from 188 to 184.
The age distribution within the adult autism programs also changed only modestly. The combined number of people ages 46–64 increased from 83 to 87, while the 21–45 group declined from 801 to 797.
The stability is notable because it contrasts sharply with the substantial enrollment changes occurring within the broader ID/A waiver system.
ID/A Waiver Spending Surpassed $4.5 Billion
Another major headline is spending.
The FY23–24 report places statewide ID/A waiver expenditures at $4.5235 billion compared with a revised FY22–23 figure of $4.1985 billion.
That’s an increase of approximately $325 million, or 7.7%, in one year.
Over the four-year period presented in the latest report, statewide ID/A waiver expenditures increased from approximately $3.384 billion in FY20–21 to $4.524 billion in FY23–24—an increase of roughly $1.14 billion, or 34%.
The geographic spending table also demonstrates just how large Pennsylvania’s system has become. In FY23–24, expenditures included approximately:
| County | Spending |
|---|---|
| Allegheny | $549.2 million |
| Philadelphia | $501.2 million |
| Montgomery | $325.8 million |
| Delaware | $305.7 million |
| Lehigh | $197.7 million |
| Berks | $176.8 million |
| Chester | $164.9 million |
| Bucks | $152.5 million |
| Lancaster | $138.6 million |
| Erie | $134.0 million |
These figures help illustrate the enormous economic scale of Pennsylvania’s ID/A service infrastructure.
Residential Service Spending Approached $3 Billion
Licensed and unlicensed residential services also represent a major portion of ODP expenditures.
The FY23–24 report lists $2.936 billion in paid amounts serving 15,082 consumers.
Using the revised historical figures presented in the new report, FY22–23 residential spending was approximately $2.719 billion for 14,876 consumers.
So consumer count increased by only about 1.4%, while spending increased by approximately 8%.
That difference is important: much of the growth in spending cannot be explained simply by a proportional increase in the number of people receiving residential services.
A note about revised data
This is one area where readers comparing the two PDFs directly could become confused.
The original FY22–23 report listed residential paid amounts of approximately $2.904 billion for 15,011 individuals.
The newer FY23–24 report retrospectively lists FY22–23 as approximately $2.719 billion and 14,876 consumers.
Because ODP has revised the historical figure, year-to-year analyses should use caution and identify which version of the FY22–23 number they are using.
Targeted Services Management Increased
Targeted Services Management moved in the opposite direction from some of the institutional programs.
The number of individuals increased from 17,095 to 17,628, while expenditures rose from approximately $24.15 million to $26.89 million.
That’s roughly an 11.3% increase in expenditures alongside a 3.1% increase in individuals served.
Meanwhile, Private ICF/ID recipient counts declined from 1,658 to 1,607, while expenditures were essentially flat, moving from approximately $412.0 million to $410.7 million.
Adult Autism Waiver Spending Was Essentially Flat Statewide
Interestingly, Adult Autism Waiver expenditures did not follow the growth seen in ID/A waiver expenditures.
Statewide AAW expenditures were:
FY22–23: $47.81 million
FY23–24: $47.54 million
That’s a slight decrease of approximately $278,000, or 0.6%.
County-level changes varied considerably, however. Lehigh increased from approximately $3.88 million to $4.41 million, while Montgomery decreased from approximately $6.35 million to $5.62 million.
Again, this reinforces that statewide totals can mask very different local trends.
Base Services Allocations Declined
The statewide allocation for Base Services decreased from approximately $110.67 million in FY22–23 in the previous report to $106.48 million for FY23–24.
Administrative allocations were comparatively stable, moving from approximately $56.11 million to $55.91 million.
That translates to a reduction of roughly $4.2 million, or 3.8%, in statewide Base Services allocations.
The PUNS Numbers Improved—but Thousands Still Report Urgent Needs
The Prioritization of Urgency of Need for Services (PUNS) data provides another important indicator.
The FY23–24 report shows:
| PUNS Category | FY22–23 | FY23–24 | Change |
|---|---|---|---|
| Emergency | 5,692 | 5,439 | -253 |
| Critical | 4,760 | 4,755 | -5 |
| Planning | 2,388 | 2,299 | -89 |
The most significant movement is the Emergency category, which fell about 4.4%.
That’s a positive direction, but the absolute numbers remain substantial. More than 5,400 people were still categorized as Emergency, and another 4,755 were categorized as Critical.
In other words, the data shows progress without suggesting that unmet or anticipated support needs have disappeared.
One Dataset Also Disappeared From the New Report
There is another structural change worth mentioning.
The FY22–23 report contained a section titled “Individuals with ID/A Under Block Grant Funds by County.” It reported 31,150 individuals statewide for FY22–23.
That table does not appear in the FY23–24 Annual Data Report. The report therefore shrank from 18 numbered data sections to 17, with PUNS becoming section 17.
That doesn’t necessarily mean the underlying population or program disappeared; it means that this particular dataset is no longer included in this annual report. The reports themselves don’t explain why it was removed.
What Does the FY23–24 Report Tell Us Overall?
Taken together, the new numbers suggest that Pennsylvania’s developmental disability system is not simply getting bigger. It is changing in composition.
Overall ODP enrollment increased about 2.4%, but underneath that modest increase are much larger movements: Community Living Waiver (CLW) enrollment jumped roughly 30%, P/FDS enrollment declined about 14%, the number of participants under age 21 increased substantially, ID/A waiver spending climbed to more than $4.5 billion, and residential spending approached $3 billion.
At the same time, PUNS Emergency numbers moved downward, institutional populations continued their longer-term decline, and enrollment in the state’s dedicated adult autism programs remained largely flat.
For providers, families, policymakers, and organizations developing new approaches to disability support, the most important takeaway may be that demand is evolving—not disappearing.
More people are being served overall. More resources are flowing through waiver-funded community services. Younger people are becoming a larger part of the ID/A population reflected in the report. And despite substantial public investment, thousands of Pennsylvanians continue to be identified through PUNS as having emergency or critical service needs, and are not being served.
An increasingly important question for Pennsylvania’s system is:
How do we expand community-based capacity while helping people build greater independence without requiring a proportional increase in direct staff support and system costs?
The FY23–24 data doesn’t answer that question—but it makes the need to answer it increasingly difficult to ignore. Though, perhaps, Independio can support the answer to this question in the longer term for Pennsylvania and beyond.