For more than a decade, Florida has used an algorithm to help determine how much funding individuals with developmental disabilities receive through its Medicaid Home and Community-Based Services (HCBS) waiver.
In 2025, the state took a closer look at that system.
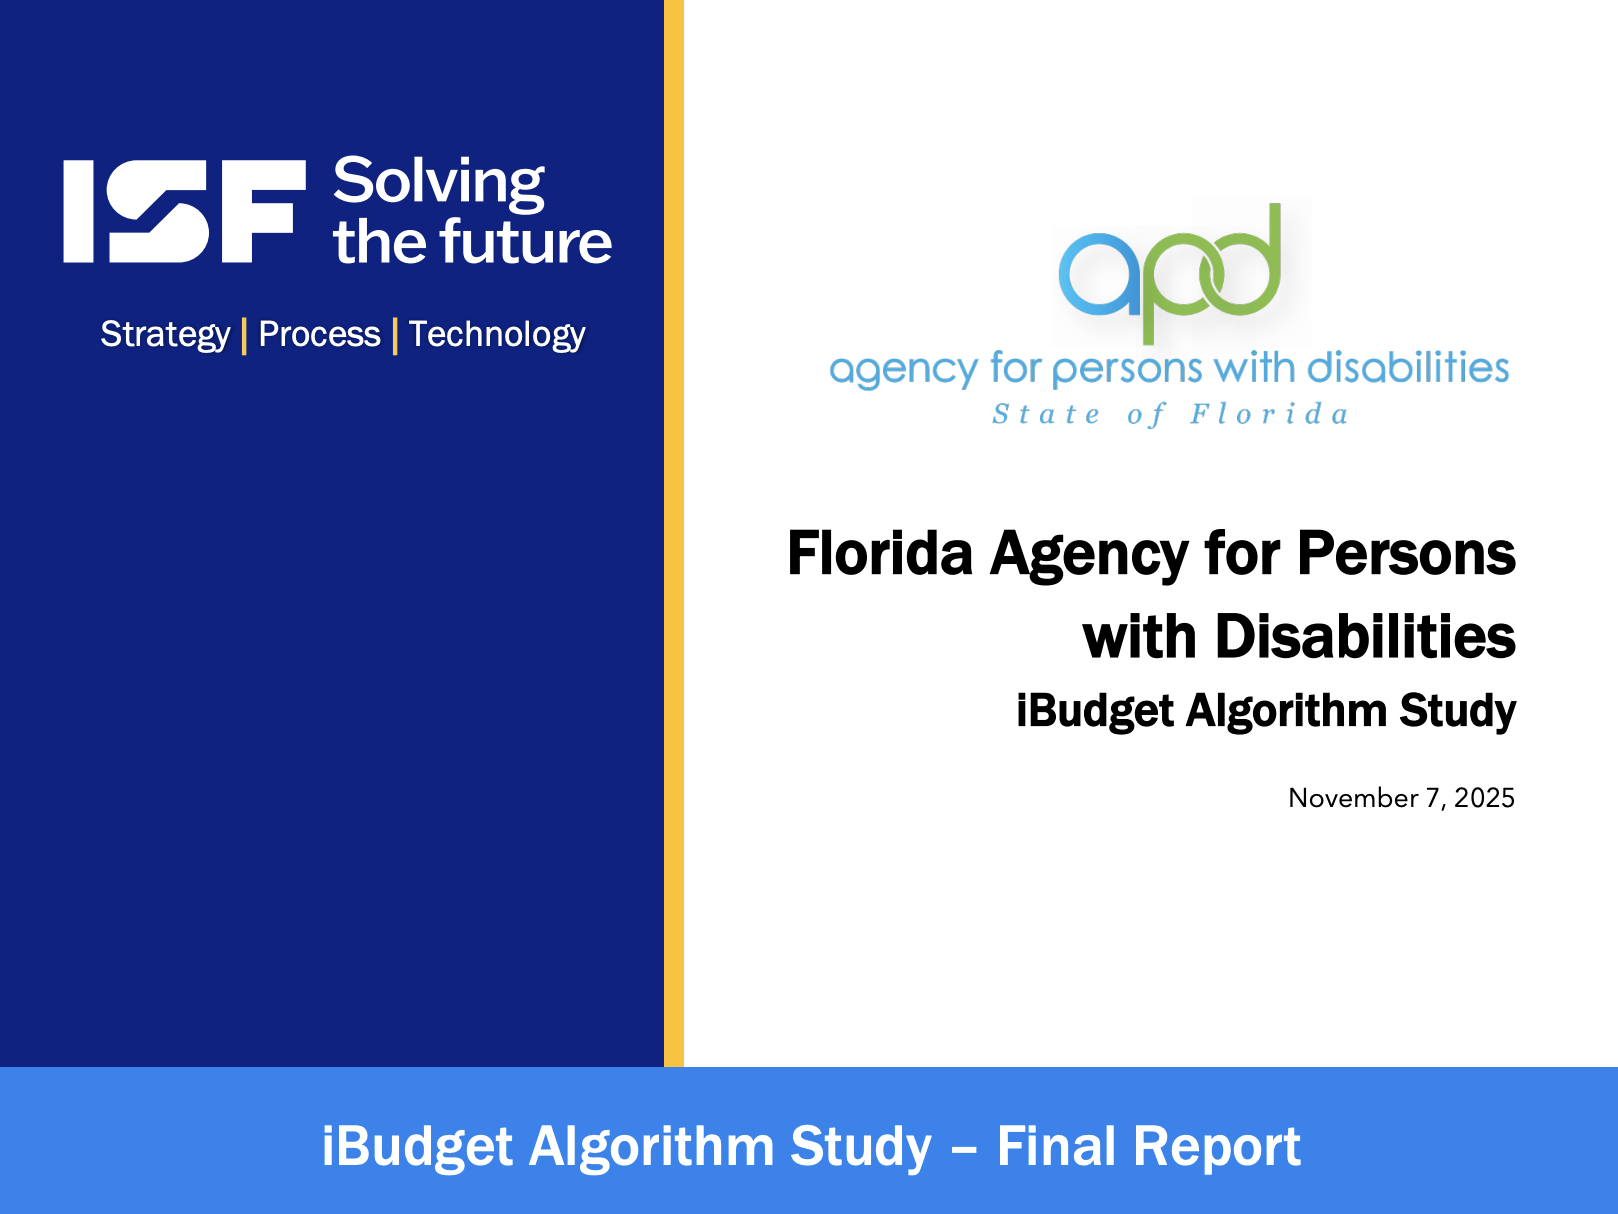
The Florida Agency for Persons with Disabilities (APD) iBudget Algorithm Study examined whether the algorithm still accurately reflects the needs and costs of the people it is designed to serve—and whether a different approach could do a better job.
The answer was significant:
Researchers found that the existing algorithm’s ability to predict current expenditures had deteriorated considerably since it was developed. They tested a series of alternatives and ultimately recommended replacing it with a machine-learning approach known as a Random Forest model.
But some of the most interesting findings go beyond which algorithm performed best.
The study raises important questions about outdated data, high-needs individuals, person-centered planning, rising service costs, and the limits of using any predictive model to determine disability-service funding.
First, What Is Florida’s iBudget?
Florida’s iBudget is part of the state’s Medicaid HCBS waiver system. It allows people with developmental disabilities to receive services and supports in their homes and communities rather than relying solely on institutional care.
At the time of the study, the program supported more than 36,000 people, with another 19,000+ individuals on the pre-enrollment list. Each participant receives an individualized budget that can fund various supports. The starting amount isn’t simply selected by a caseworker. Florida uses an allocation algorithm.
The algorithm considers information such as a person’s:
- age;
- living setting; and
- responses to the Questionnaire for Situational Information (QSI), which contains information related to behavioral, functional and physical support needs.
If the resulting budget does not adequately address someone’s individual needs, Florida also has a Significant Additional Needs (SAN) process through which additional funding can be requested.
In other words, the algorithm isn’t intended to understand everything about a person’s life. It provides a standardized starting allocation, while additional review processes address circumstances the formula doesn’t adequately capture.
Why Did Florida Study the Algorithm?
The answer begins with age—not the age of the participants, but the age of the data behind the algorithm. Florida’s existing algorithm, called Model 5b, was developed in 2015 using expenditure data from FY 2013–14. By 2025, the model was therefore relying on relationships derived from data that was more than a decade old.
That’s important because the disability service system did not remain frozen during those 11 years.
The report identifies approximately 30% service-cost inflation, along with changes in demographics, service-delivery models, community-based care, regulatory requirements, provider rates and other factors. Researchers found that the old model did not adequately reflect some of these changes.
Florida’s 2025 House Bill 1103 consequently required APD to commission a comprehensive review of the iBudget allocation algorithm.
The study essentially asked:
Does the algorithm that worked for Florida’s disability system a decade ago still accurately represent the system—and the people using it—today?
What Was Wrong With the Existing Algorithm?
The study did not conclude that Model 5b was useless or fundamentally illegitimate. In fact, the report says the existing algorithm provides a legally defensible, interpretable and auditable allocation method.
The problem was that its predictive performance had deteriorated when applied to today’s population and expenditures.
The original study reported an R² of approximately 0.80, meaning the model fit the historical data quite well. However, the new study cautions against directly comparing that number with the new results because the 2015 analysis measured in-sample fit, while the 2025 study used modern out-of-sample testing to evaluate how well models predict unseen data.
When researchers recreated Model 5b and evaluated it using FY2025 data, its out-of-sample R² was 0.2528.
In plain English: the relationships captured by the old algorithm no longer predicted current expenditures particularly well.
The researchers identified several examples of this “temporal disconnect,” including systematic underestimation of costs for intensive behavioral supports, overestimation of some residential habilitation costs, difficulty accounting for newer service approaches, and an inability to reflect current workforce costs and provider-rate structures.
There Was Another Problem: The People Who Look Like “Outliers”
One of the most consequential parts of the study concerns statistical outliers.
When the original Model 5b was developed, 9.4% of cases were removed as outliers to improve the model’s statistical fit.
In many statistical applications, removing unusual observations can make sense.
Disability services create a different problem.
A person whose support costs are dramatically higher than everyone else’s may not represent bad data at all. They may simply be a person with very complex and legitimate support needs.
The 2025 report explicitly recognizes this issue. It argues that excluding high-cost observations when training a resource-allocation model risks producing estimates that fail to represent the full range of care needs.
For that reason, the alternative models in the final study were developed using 100% of the available data, including outliers.
That may be one of the study’s most important lessons: in human-services data, an unusual case isn’t necessarily an error to remove. Sometimes the “outlier” is precisely the person a support system needs to understand.
How Did Researchers Study It?
The researchers used a three-stage process.
First, they conducted a current-state assessment of Model 5b. They examined its mathematical structure, assumptions, variables, treatment of outliers and performance against more recent expenditures.
They recreated the existing algorithm in Python, validated that implementation using mock data, and then tested it using historical APD data.
Second, they developed and tested 10 alternative algorithmic approaches. Three were eventually excluded because they did not produce the single budget allocation required under Florida law, leaving seven alternatives for full comparison.
The approaches ranged from updated versions of traditional linear regression to more sophisticated statistical and machine-learning techniques.
For model development, the researchers examined multiple years of APD data and used recent fiscal-year data for training, testing and validation. Rather than simply asking which model fit existing records best, they used train/test methods to determine how well models could predict data they had not been trained on.
They compared models using measures including R², Root Mean Squared Error and Mean Absolute Error.
Finally, they conducted an impact analysis, looking at what the recommended model could mean for individual budgets, statewide funding, implementation, regulation and APD’s technology systems.
They Also Asked the People Affected by the System
The study wasn’t exclusively a mathematical exercise.
Researchers gathered input from self-advocates, families, providers, advocacy organizations, statewide associations and researchers, representing experiences across rural, suburban and urban communities and different living arrangements.
Several themes repeatedly emerged.
Stakeholders wanted allocations that more accurately reflected rising service costs. They described a need for larger initial allocations so people were not forced to prioritize among essential supports. They also raised concerns about services for school-aged children, the changing needs of aging participants, the SAN process, and the difficulty families can experience navigating iBudget.
Stakeholders also wanted the algorithm validated more frequently as costs and participant needs change.
That last point ultimately became part of the study’s recommendation.
What Alternatives Did They Test?
The final report compared seven viable approaches:
| Model | Approach | Test R² |
|---|---|---|
| Model 1 | Re-estimated Linear Regression | 0.4931 |
| Model 2 | Generalized Linear Model | 0.4259 |
| Model 3 | Robust Linear Regression | 0.4977 |
| Model 4 | Weighted Least Squares | 0.5169 |
| Model 5 | Ridge Regression | 0.5202 |
| Model 6 | Log-Normal Regression | 0.4598 |
| Model 9 | Random Forest | 0.6575 |
The winner was Model 9: Random Forest.
What Is a Random Forest?
Despite the name, there are no forests involved.
Think of a decision tree as a series of branching questions.
Instead of relying on one tree to make a prediction, a Random Forest builds many decision trees, each examining somewhat different samples and combinations of information.
Each tree makes its own prediction.
The model then averages those predictions to produce the final estimated budget.
The recommended version described in the final report uses 150 decision trees and 53 selected features.
This matters because people’s support needs don’t necessarily behave like a simple straight-line equation.
Age, living arrangement, behavioral needs, functional needs and other factors can interact in complicated ways. Random Forest can identify nonlinear patterns and interactions without researchers having to manually specify every possible relationship.
How Much Better Was the New Model?
When compared with Model 1—essentially the existing Model 5b structure rebuilt with current data and predictors—the Random Forest model performed substantially better.
Its test R² increased from 0.4931 → 0.6575.
The study describes this as approximately a 33% improvement in predictive performance.
Its Root Mean Squared Error also fell from approximately $32,359 → $26,618.
an improvement of roughly 18%.
And importantly, neither Model 1 nor Model 9 excluded outliers in the final comparison.
The researchers therefore recommended that Florida consider Model 9 for implementation.
But “more accurate” does not mean “perfect.”
The study repeatedly emphasizes that algorithms produce generalized predictions based on historical patterns. No model can capture every person’s circumstances.
That’s why the report says individualized processes such as SAN would remain necessary even with the new algorithm.
What Would Happen to People’s Budgets?
This is where the study becomes especially interesting.
Researchers modeled what would happen if Model 9 were used for the current population.
The results suggested that:
- 21,106 people (about 59.5%) would have a higher predicted budget.
- 14,016 people (about 39.5%) would have a lower predicted budget.
- 322 people (about 0.9%) would see no predicted change.
However, the study specifically states that people whose Model 9 estimate was lower would not have their existing allocation reduced, because their services had already been approved as medically necessary.
That protection is crucial to understanding the study’s estimated cost.
The Proposed Model Would Require More Funding
For FY24–25, the study identified approximately $1.681 billion in actual iBudget service expenditures.
Model 9’s unconstrained predicted total was approximately $1.579 billion—actually below current expenditures.
But Florida cannot simply reduce someone’s previously approved medically necessary services because a new model predicts a lower amount.
So the researchers also calculated a maximum-cost scenario, taking the higher of the current and predicted amount for each individual.
Under that approach, total funding would reach approximately $1.948 billion.
That is about $267 million more than current expenditures—a 15.9% increase.
So the study’s 15.9% figure does not mean the Random Forest simply predicts that Florida’s existing services should cost 15.9% more.
Rather, it reflects what the system could cost if people predicted to need additional funding received it while nobody with an existing approved allocation had their funding reduced.
That distinction is important.
Some Groups Saw Very Different Results
The impact analysis also revealed that the model did not affect every population in the same way.
- For people ages 21–30, the average modeled allocation increased from $36,748 to $44,680, or 21.6%.
- For people age 31 and older, the average increased approximately 13.4%.
- For children and young adults ages 3–20, the modeled increase was much smaller at 2.2%.
- Living arrangements produced even larger differences.
- For Independent/Supported Living, predicted average allocations increased approximately 13.3%.
- For Residential Habilitation 1, they increased a striking 56.6%.
- But Residential Habilitation levels 3 and 4 produced substantially lower predictions—approximately 37.5% and 61.1% lower, respectively.
The researchers explicitly flagged these categories, noting that Model 9 did not accommodate those service levels as well and that participants could require SAN requests.
This is an important limitation.
A model can perform better across an entire population and still perform poorly for particular groups.
That’s one reason the report recommends pilot testing, monitoring and continued individual review rather than immediately replacing the existing algorithm statewide.
Could a Machine-Learning Algorithm Become a “Black Box”?
That’s another issue the researchers confronted directly.
A traditional regression model can be relatively easy to explain: particular variables have coefficients, and those coefficients contribute mathematically to the result.
A Random Forest containing 150 decision trees is considerably harder to explain.
For a system determining access to disability-service funding, simply saying “the computer calculated it” obviously isn’t sufficient.
The study therefore recommends several explainability tools, including SHAP values, Partial Dependence Plots and individual tree paths.
SHAP values are particularly interesting because they can show how individual factors contributed positively or negatively to a specific person’s prediction.
The goal is to make it possible to explain not merely what the model predicted, but why particular information influenced that prediction.
The report concludes that Model 9 can satisfy Florida’s transparency and regulatory requirements when paired with these explainability tools.
The Study Looked at Services, Too
The project didn’t stop at the allocation formula.
Researchers compared Florida’s waiver services with services available in other states, including Pennsylvania, Ohio, Texas, California, Michigan and others.
They ultimately identified four areas Florida might consider expanding or adding:
Host Homes — a residential model in which a person with a developmental disability lives in a private home with someone providing supports.
Training and counseling for unpaid caregivers — supports intended to help family members and other unpaid caregivers develop the knowledge and skills needed to support the individual.
Expanded remote support and monitoring — building upon Florida’s existing supports with technologies and approaches used more broadly in states such as Ohio.
Peer mentorship — support from peers designed to promote self-advocacy, decision-making and successful community living.
The report does not recommend immediately adding all four. It says further analysis would be necessary to determine utilization, actual Florida costs, funding requirements, federal approval and regulatory changes.
Still, their inclusion is notable because the study recognizes that improving an allocation formula is only one part of improving HCBS.
A better budget algorithm can only allocate funding among the supports the system actually makes available.
What Happens Next?
The report recommends phased implementation rather than an immediate statewide switch.
Its proposed framework includes infrastructure development, approximately two months of pilot testing involving 5,000 participants, a six-month parallel run in which Model 9 and Model 5b operate side by side, staff training, regional rollout and eventually statewide implementation.
The report estimates approximately $500,000 in technical implementation and ownership costs over three years, although that estimate does not include all programmatic costs, such as broader stakeholder communications and documentation changes.
More importantly, researchers recommend that the model not be allowed to sit unchanged for another decade.
The final report calls for recalibration when material changes occur in service costs, utilization patterns or the population—including when the population served changes by more than 5%.
The Bigger Lesson From Florida’s iBudget Study
Florida’s study demonstrates both the potential and the limits of using data to allocate disability services.
The lesson isn’t simply that machine learning is better than linear regression.
It’s that the data behind an allocation system has to evolve along with the people and service system it represents.
Florida’s existing algorithm was built using 2013–14 expenditures. Since then, provider costs changed, services evolved, the population changed and the way people receive community supports continued to develop.
Eventually, even a model that once performed well can become disconnected from the system it is supposed to represent.
The study also highlights something particularly important for disability services: statistical efficiency and person-centeredness are not necessarily the same thing.
Removing unusual high-cost cases might improve a model’s statistical fit. But those cases can represent real people with unusually complex support needs. A system that becomes more mathematically elegant by excluding them may become less representative of the people it is intended to serve.
At the same time, Florida’s recommended model still doesn’t eliminate individual variation. It predicts some residential populations less effectively than others, relies on historical expenditures, and cannot anticipate circumstances entirely outside its training data.
That’s why perhaps the most important conclusion of the 156-page study is not the recommendation of Random Forest at all.
It’s the recognition that no algorithm can fully determine what one individual needs.
Algorithms can help states distribute billions of dollars more consistently. They can identify patterns across tens of thousands of people. They can